One of the fundamental aspects of friction is genesis of friction that is force generation and transmission between the surfaces in contact. The genesis of friction is the most important energy consuming mechanism than other interfacial considerations. Right from Amonton (1699) to Bowden (1930s) and Tabor (1950) have proposed many theories to explain friction. Among these friction theory dominated all others over many decades. But the large variations in the experimental values and calculated values have not been solely explained by adhesion theory. The more realistic model is explained in terms of three different mechanisms by Nam. P. Suh and H. C. Sin (1981). Those are namely adhesion, asperity deformation and plowing.
The frictional force depends on the history of sliding. Frictional force undergoes significant variation during the early stages of sliding before it reaching steady state. This behavior is important in tribology not only because of frictional force and also of generic effect on wear. To explain the genesis of friction Nam.P. Suh and H, C. Sin have done a set of experiments and those detail given below briefly.
Testing method adopted was cross cylinder geometry with one stationary and other moving. The parameters were 1kg normal load, 0.02m/s-sliding rate for total of 32 m length at room temperature. The test was carried out in argon atmosphere and the normal and fractional force was measure by dynamometer recorder assembly. The materials taken for the testing were Arco Iron, AISI 1020, 1045, and 1095. and also OHFC copper polished up to 4/0 slid against AISI 1020 steel. Out of the results following two points are important
· Coefficient of friction changes as a function of sliding distance at early stages. It has usually low value and increases gradually until reaching the steady state. After reaching the maximum value some times coefficient of friction decreases to the steady state if the stationary slider is harder than the moving specimen. The same pair of specimen does not show such a result when those are reversed. The initial value of coefficient of friction observed was 0.1 to 0.2 regardless of the materials..
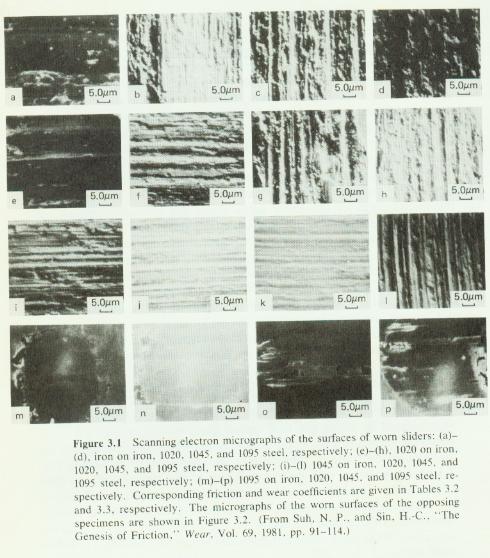
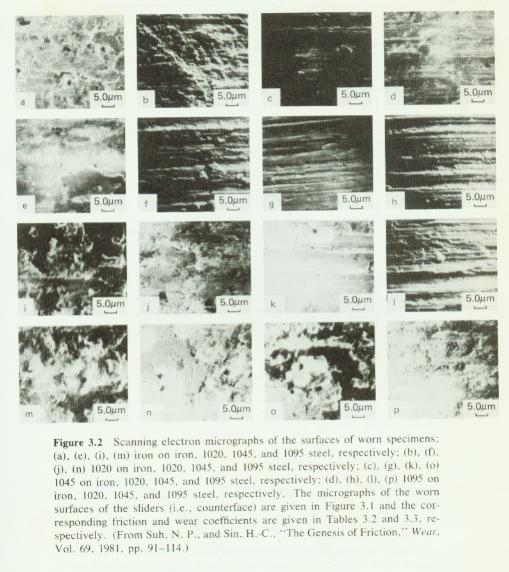
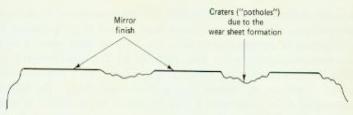
· Steady state coefficient of friction and wear rate higher when identical metals are slid against each other than harder stationary slider slid against softer specimen. Where as the coefficient of friction in softer stationary slider slid against hard moving specimens as identical specimen. In this case wear is much higher in different material sliding. This behavior related to the SEM photographs worn out surfaces. These figures shows that when harder stationary slider slid against softer moving specimens, harder specimen gets mirror polishing and the material underneath the mirror polished surface fails and forms the new asperities and those gets mirror polish and so on. But this does not happen for the reverse combination and identical materials because softer surface wear continuously. The wear particles gets entrapped in-between the surfaces and many plowing surfaces are seen in the topography.
· The initial value of coefficient of friction observed was 0.1 to 0.2 regardless of the materials and weather lubricant is used or not.( for Au-Au, Cu-steel and Brass –steel)
 |
Out of the experimental results one can understand coefficient of friction cannot be explained solely by adhesion theory. So the friction coefficient is the combined effect of asperity deformation (μd), plowing by wear particles (μp) and adhesion between the flat surfaces (μa).. to clarify the time dependant frictional behavior of the material tested., the plot of friction vs. sliding distance will be subdivided into six sages as show in fig.4
Fig.5. Hard stationarysurface polished by
soft surface
1. Asperity deformation
2. Plowing
3. Adhesion
Asperity deformation determines the static coefficient of friction and also affects the dynamic coefficient of friction. But contribution is less than plowing and adhesion.
Consider two asperities coming to contact with each other, they have to deform in a manner that the resulting displacement field is compactable with sliding direction and that the sum of vertical components of the surface traction at the contacting asperities must be equal to the normal applied load. Consider the following diagram, the solution demand that shear stress along OA be what ever is necessary to satisfy the condition that
q = a , which is necessary to constrain the deformation to the sliding direction. This would be possible even under the lubricated condition if the inter OA not perfectly smooth enough to cause mechanical interlocking. The general solution ( md = tan q ) s sketched in the following figure.
If it is assumed that the asperity deformation is the only phenomenon that takes place at the interface and is entirely responsible for the frictional force under a given load, the coefficient of friction due to asperity deformation various from 0.39 – 1 as the slope of the asperity increases from 0 – 45o. These values are closer to the static coefficient of friction. This is well suited for the rough surfaces as like identical specimens slid each other.
Consider two nearly flat surfaces coming into contact (rubbing contact) as shown in fig.8. Depending on the nature of adhesion along the interface ED, the required to move the rubbing surface with respect to each other varies. When there e is no adhesion force required is zero and it is maximum when there is complete adhesion.
Solution has been derived based on the slip line field is give below
μa= [A sin
α + cos (cos-1f - α)]
/ [(A cos α + sin (cos-1f
– α)]
Where
f - strength of adhesion at ED as
expressed as the fraction of
shear flow
strength of the soft material.
α – slope of the hard asperity
for nearly flat surfaces α tends to 0, therefore
μa= f / (A + sin (cos-1f –
α)
Where
A = 1 + π/2
+ cos-1f
μa various from 0 to 0.39 as f changes to 0 to 1. the friction force calculated by the above formula is based on the assumption that all the load applied is carried by the flat surfaces. Under the typical condition μa should be less than 0.4 but the experimental result of hard stationary slider slid against soft specimen shows that the steady state value of 0.51 when both surfaces polished smoothly. This result conforms the contribution of asperity deformation and plowing component.

μp = 2/π { (2r/w)2
sin –1(w/2r) – [(2r/w) - 1]1/2 }
where w is width of penetration and r is radius of curvature of the particle.
1. Nam P. Suh, Tribophysics, Prentice Hall, INC, New Jersey ,1986
2. Nam P. Suh and H. C. Sin, The Genesis of friction, Wear, 1981, 91-114